10 Year Recovery Boiler Incident Statistics
A total of 573 domestic recovery boiler incidents were reported to BLRBAC between fall 2009 and spring 2019. And we looked at every one of them, analyzing and categorizing, so that we can bring this interesting data to you.
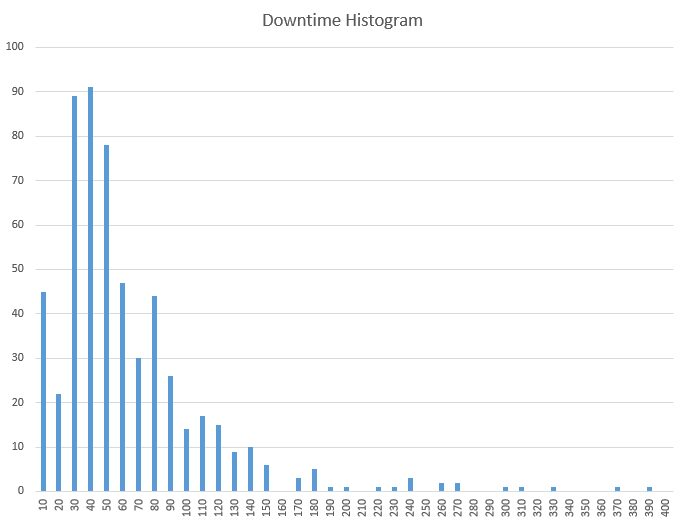
Boiler Downtime
First, let's look at the downtime. Median downtime was 46 hours per incident. The longest 10-percentile lasted over 119 hours and the best 10-percentile was less than 16. The latter probably due to suspected leaks yet after a shutdown, no leak was found.
Here is the downtime histogram
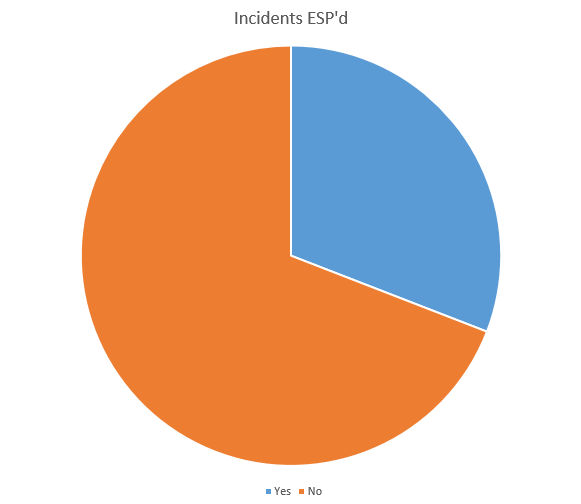
ESP Decisions
Next, let's have a look at ESP decisions. How many were ESP'd? A total of 177, which makes it a 31% of all incidents.
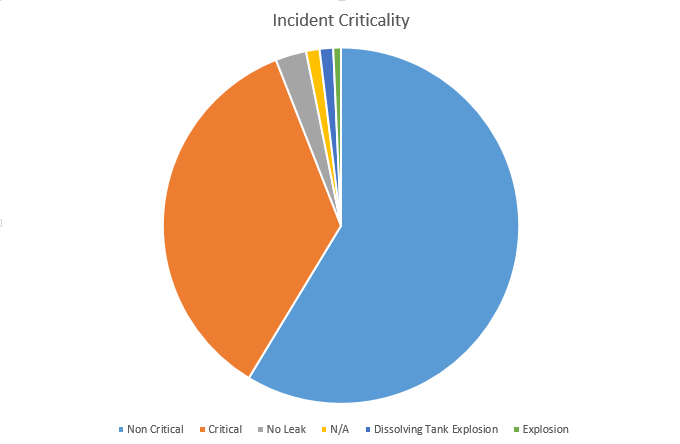
Incident Criticality
How critical were the incidents? Did they lead to an explosion? Was there a potential for an explosion?
- 59% Non-critical
- 35% Critical
- 3% No Leak Found
But we had:
- 7 Dissolving Tank Explosions
- 4 Smelt Water Furnace Explosions
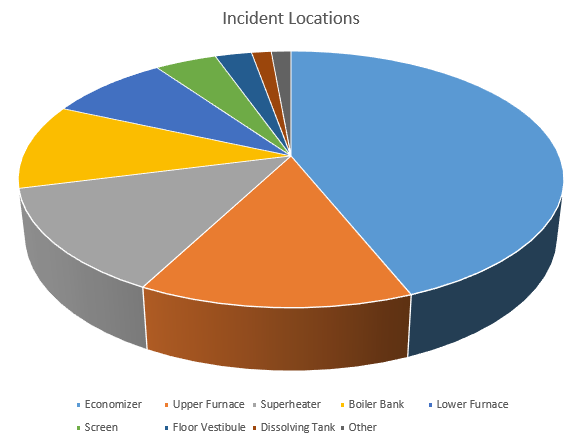
Incident Location
Next, let's have a look at where did the incidents occur? 43% of incidents were reported in the economizer. And that explains why most of them were not critical. However, 14% were in the upper furnace, 13% in the superheater area, 11% in the generating bank area, and 8% in the lower furnace.
How were leaks discovered?
The final statistic is the most interesting one. How are these leaks discovered? While many measures are made in order to prevent smelt-water reactions, once a tube leak occurs, the faster we identify and categorize it, the faster we can react and prevent a potential disaster. The following statistic speaks for itself:
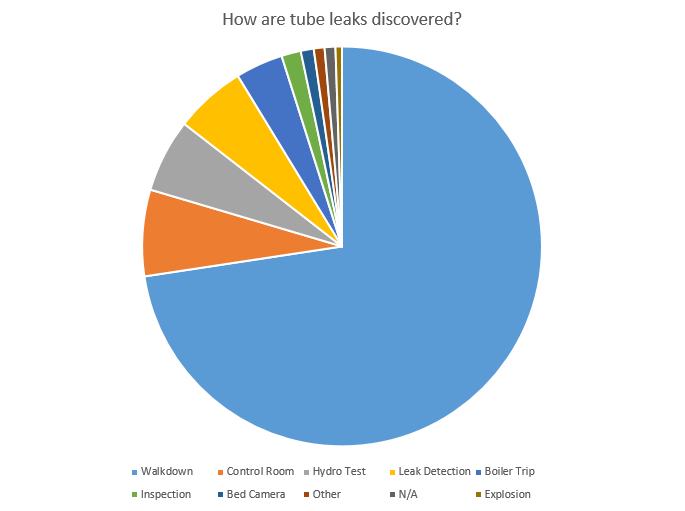
73% of all tube leaks are found by an operator walkdown and is a primary and prevalent method of recognizing and identifying a tube leak. No automated method has been found yet that has this reliability.
Followed by 7% identification in the control room DCS screens (again by an operator). This includes finding indications that make an operator suspect there is a leak and investigation is started.
Followed by 6% of leaks found during a hydro test after an annual shutdown.
Automated leak detection initiated an investigation for another 6% of all incidents. While automated leak detection systems are getting better, they cannot be relied on to be a primary identification method of tube leaks.
Followed by 4% when a boiler tripped and another 1% where an operator saw a bed camera showing dark areas and initiating an investigation.
Conclusion
When it comes to tube leaks or preventing dissolving tank explosions, field operators are the most important assets for identification but also classification and decision making behind this process. No automated process has even closely matched the efficiency of field operators. Boiler walk down remains the primary method of finding tube leaks and preventing smelt water reactions.
As such, it is critical that operators have the knowledge but also confidence to make these decisions. And because these incidents are rare, most operators do not have the experience for the investigation and decision making. Recurrent and effective training is one of the steps to keep them up-to-date and ready, should an incident occur.
Next time, we will look at the ESP statistics. How long does it take to push the ESP buttons after a leak has been identified? And what is the risk curve between the ESP decision making time and explosion potential? How much time do we really have?


